Data Mining, Visualizations & Certifications
Part of my coursework for my data analytics minor includes an introduction to data mining course as well as a Python programming course. The work below are the projects and coursework I enjoyed the most throughout my semester.
I completed this visualization when the United States reached the highest number of COVID-19 deaths that we had ever seen in mid-October. The data set was obtained from the Center for Disease Control website and included counts of county and race/ethnicity.
Multiple Regressions
Data mining is used to generate new ideas and insights from large sets of data to then make important strategic decisions. On a recent assignment in my data mining course, we were asked to run a multiple regression on a set of employee travel data to determine the best model to use to calculate travel reimbursement.
To determine the best model, I looked at the three models provided to me, while looking at the outputs of the models, I decided to use Model B (due to a strong relationship indicated by the R value and a step-wise function that eliminated a variable that was too highly correlated with another variable). Then, to estimate reimbursement costs, I used this model with provided inputs to determine if the employee was overpaid or underpaid in their reimbursement.
The model I used and the interpretation of variables.

I then used the model to predict if the employee was paid too much in their reimbursement and by how much. This model could be extremely useful in determining the margin of error in an HR department/ payroll!
Certifications
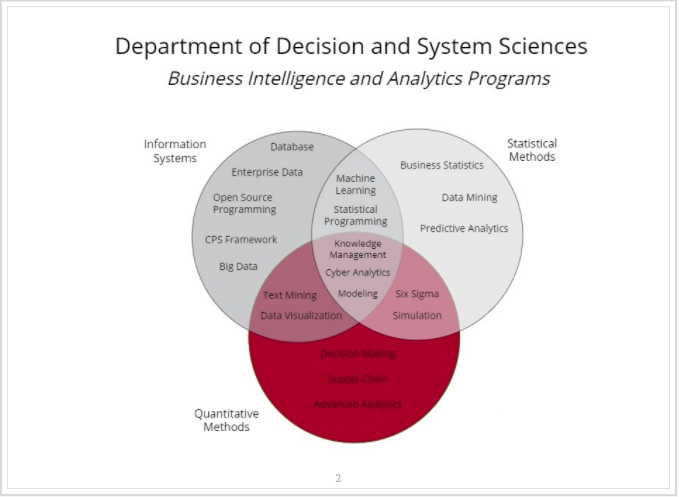
BIA Slidedeck Excerpts